About My Research
I do bioinformatics research, using Python and RStudio to test out new ideas and dig into complex biological data. I mainly focus on analyzing genomic information to help us understand the life sciences better and spark fresh innovations in health and medicine. Additionally, I conduct research in psychology-related fields, exploring the interplay between biological processes and cognitive behavior.
In collaboration with universities and research groups, I provide expert data analysis that supports innovative research initiatives. I tailor proven analytical techniques to meet the unique challenges of each project, ensuring that every study benefits from precise, data-driven insights.
On this page, you’ll find a detailed overview of my projects. Each project highlights a distinct aspect of my research—from applying established analytical methods to conducting comprehensive data analyses on real-world datasets. The source code of each project is available on my GitHub account.


Research Projects
Here, you can explore my research projects related to Bioinformatics and Psychology. Scroll down to learn more about each area.


Psychology


Bioinformatics
1.IQBoostSim: Simulating Training Program Effects on IQ in R
1.About the Project
This project is an IQ simulation designed to explore how different training programs might impact cognitive performance. It begins by generating baseline IQ scores for a group of participants, then assigns each participant to one of four training categories—ranging from intensive programs with a math component to no training at all. Each training type is associated with a specific IQ boost, representing the potential benefits of that intervention. The goal is to model how structured educational or training experiences could hypothetically enhance cognitive abilities, providing a framework to analyze and compare the effects of these different approaches.
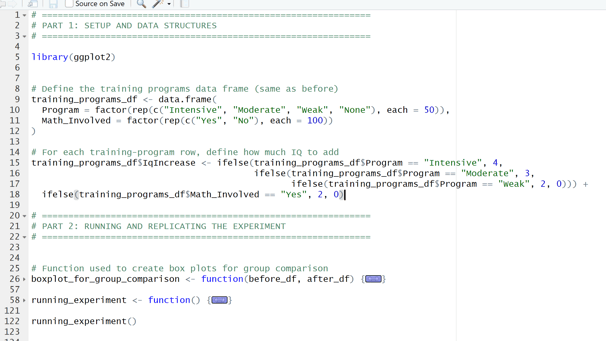
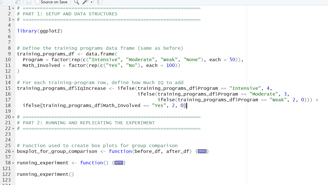
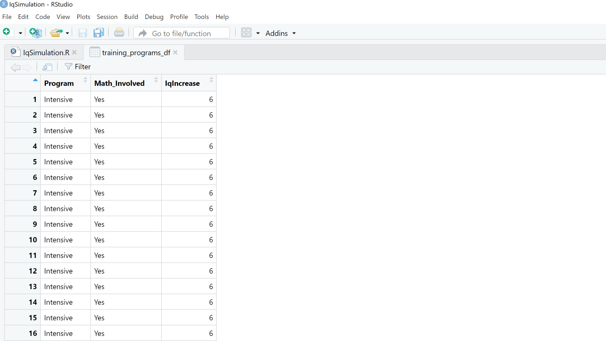
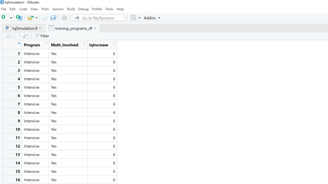
Image 1 – This code is responsible for creating the training program.
Image 2 – Here is what the data frame containing the training programs and their cognitive development boosts looks like.
2.How the project works
This section delves into the core functions driving the simulation. The running_experiment() function orchestrates everything: it generates random baseline IQ scores, assigns participants to various training programs, applies the appropriate IQ boosts, and then combines the results into final “before” and “after” datasets. To visualize and summarize these outcomes, boxplot_for_group_comparison() merges both datasets, creates a comparative box plot of IQ distributions across different training groups, and provides descriptive statistics to show how each intervention may impact cognitive performance.
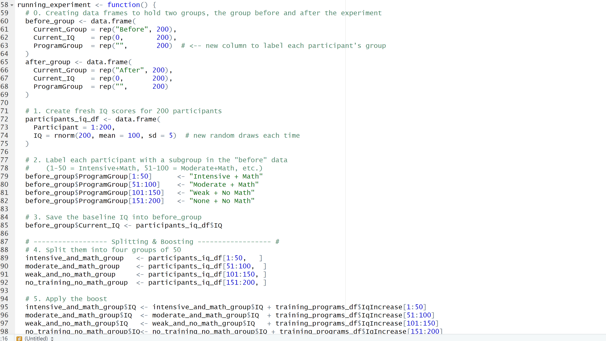
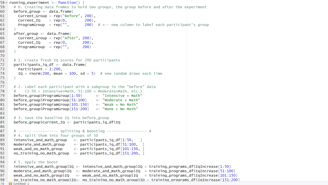
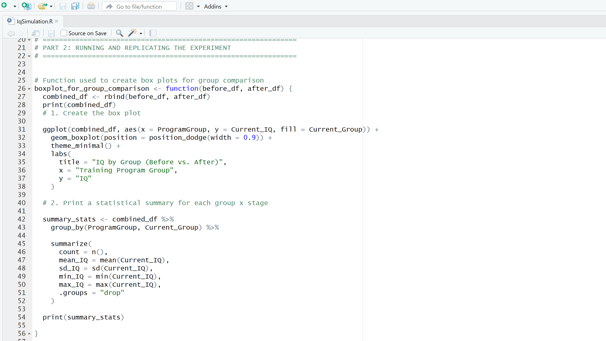
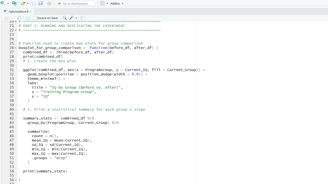
Image 1 – Here is the running_experiment() function, responsible for generating random baseline IQ scores.
Image 2 – This function generates a box plot to compare IQ distributions across different groups and produces summary statistics, highlighting how IQ scores shift from the “before” to “after” stage.
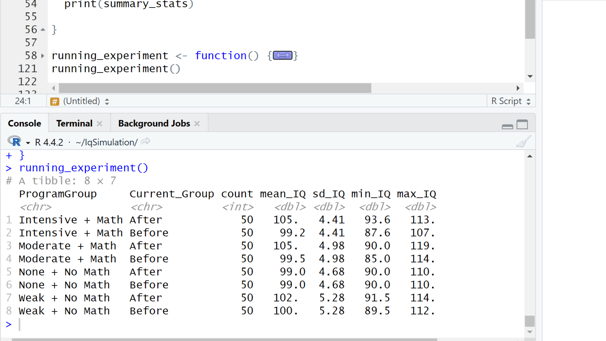
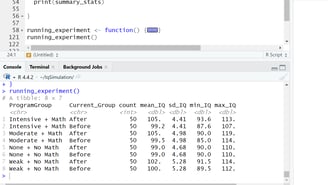
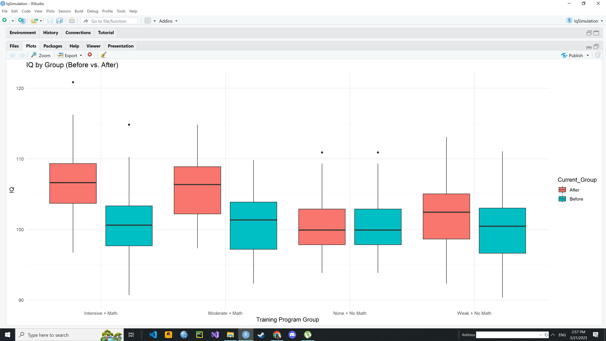
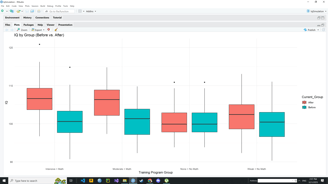
Image 3 – The console output shows summary statistics for each training program group, including mean IQ, standard deviation, and the range of scores before and after training.
Image 4 – This box plot compares the IQ distributions across all groups, visually highlighting how scores shift from the “Before” to “After” stage.
3.Conclusions
The simulation's box plots and summary statistics indicate a clear improvement in IQ scores across various training groups—especially those with intensive or math-enhanced programs. Researchers can build on these promising results by transforming the simulation into a real-world experiment, creating tailored training programs, and involving participants in separate groups. The goal would be to test whether these programs lead to increases in cognitive development (IQ) and whether the mean IQ of each group rises as observed in the simulation, along with examining if there are statistically significant differences between the groups
2.Cell Experiment
1.About the Project
This project simulates how different cell types respond to a growth factor treatment in a controlled, computational environment. Using the R programming language, the project leverages object-oriented programming with S4 classes to represent individual cells. Each cell is characterized by a unique identifier, cell type (categorized as Stem, Differentiated, or Cancer), a baseline division rate, and a gene expression level. By creating a mixed population of cells and applying a treatment that alters these attributes, the experiment aims to provide insights into the varying responses of healthy versus cancerous cells under the same external stimulus.
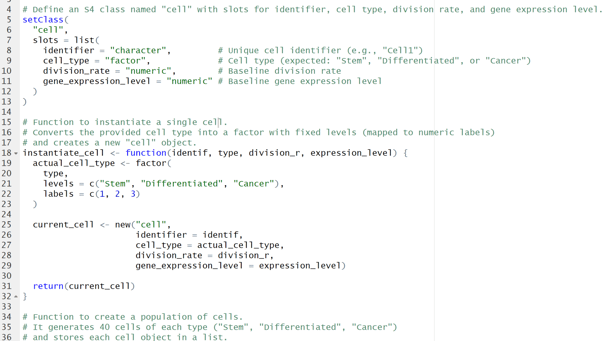
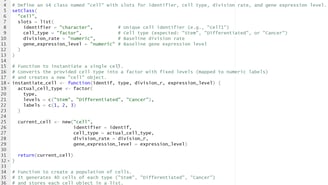
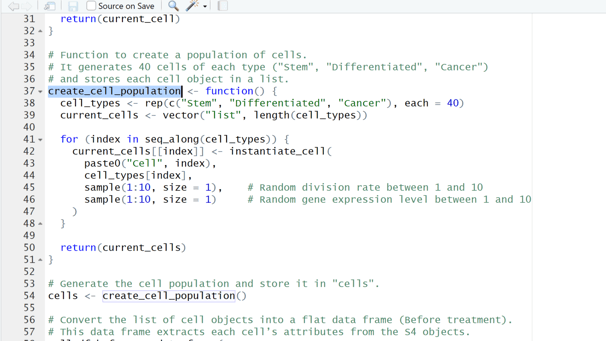
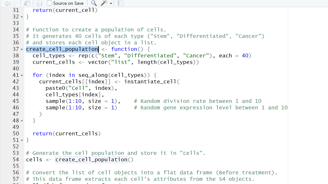
Image 1 – This code is responsible for creating the 3 types of cells(Stem, Differentiated, Cancer).
Image 2 – The create_cell_population() function generates a total of 120 cells, allocating 40 per type, which are then prepared for treatment.
2.How the project works
The create_cell_population() function generates a population of cells with random baseline division rates and gene expression levels across three cell types: Stem, Differentiated, and Cancer. The apply_growth_factor() function simulates treatment effects by amplifying gene expression and adjusting division rates—doubling for healthy cells and halving for cancer cells—to produce “before” and “after” datasets. Finally, boxplot_for_group_comparison() and make_summary() visualize these changes and provide descriptive statistics, illustrating how the treatment impacts cellular behavior.
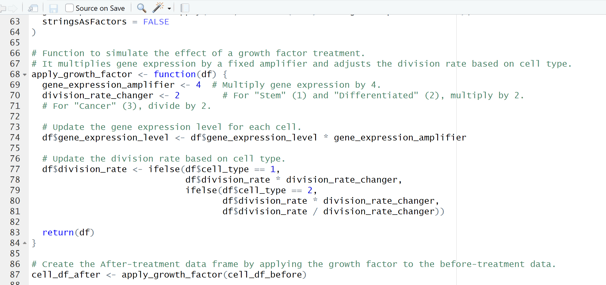
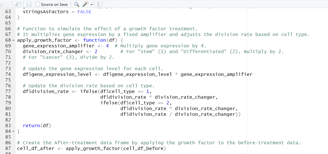
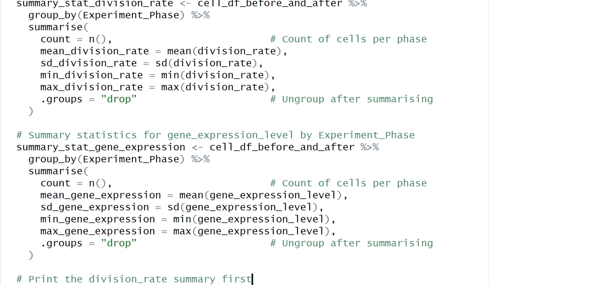
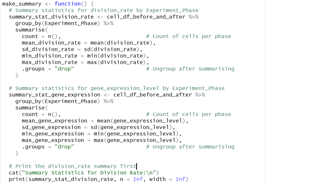
Image 1 – This code is responsible for applying the growth factor to the cell population and preparing the final “before” and “after” data frames.
Image 2 – This code groups cell data by experiment phase and calculates count, mean, SD, min, and max for the division_rate and gene_expression_level.
3.Conclusions
This simulation code offers a straightforward way to explore how a growth factor impacts cell populations, showing clear increases in gene expression and changes in division rates. Researchers can extend it with new or fictional input values to predict cellular outcomes, then compare those predictions against real-world experiments. Such an approach helps bridge computational modeling and actual lab studies, providing valuable insights into potential strategies for controlling cell behavior.